
What you can measure without user IDs
Pricing pages are where intent concentrates, but they’re also where measurement often breaks down when you avoid cookies and persistent identifiers. You can still quantify revenue impact from a pricing page change using a before/after method that relies on first-party events and aggregate math rather than user-level stitching.
The core idea is simple: treat the pricing page update as an intervention, define a stable observation window before and after, and compare revenue per relevant session (or per landing view) while controlling for obvious confounders like acquisition mix and seasonality. Privacy-first analytics tools such as plausible.io are well suited here because they already focus on aggregated reporting and event-based measurement without cookies.
Define the intervention and the measurement unit
Start by being explicit about what changed and when it shipped. “We redesigned pricing” is too vague. Capture an exact deploy time (for example, 2026-08-20 14:05 UTC) and list the elements that plausibly affect purchase behavior: plan order, copy, default billing cadence, new social proof, removed FAQ, and so on.
Then choose the measurement unit you can observe without IDs:
- Pricing page sessions (sessions that include at least one pricing pageview)
- Pricing page entrances (sessions that start on pricing)
- Pricing pageviews (less ideal because a single session can include multiple views)
For revenue impact, the cleanest unit is usually revenue per pricing session because it aligns with “a person considered pricing and then paid” without needing to know who they were.
Instrument first-party events for revenue attribution
This method depends on a small set of events you control end-to-end. Keep the taxonomy stable across the entire analysis window.
Minimum event set
- pricing_view: fired on pricing page load (optionally with properties like billing cadence shown, plan cards rendered, or currency)
- checkout_start: fired when a user clicks a primary CTA that leads to checkout
- purchase: fired on a first-party confirmation page or server-side after payment is confirmed
The purchase event is where you attach revenue. If you can, include:
- amount (numeric)
- currency (ISO code)
- plan (string)
- billing (monthly/annual)
If your payment provider redirects across domains, you may need extra care to preserve attribution without cross-site cookies. In that case, it helps to think in “first-party evidence” rather than identity graphs. The patterns in Measuring Multi-Domain Journeys Without Cross-Site Cookies are a practical complement to this approach.
Pick comparable before and after windows
Before/after is only persuasive when the windows are comparable. Use these rules of thumb:
- Match weekdays: compare whole weeks to whole weeks (e.g., 14 days before vs 14 days after).
- Exclude the deploy day if the change rolled out gradually or was A/B tested briefly.
- Freeze marketing changes if possible: avoid launching a major campaign mid-window.
- Keep pricing constant: this is about the pricing page, not the price itself (if the price changed, call that out and treat it as a different intervention).
If your traffic is low, extend the window until you have enough purchases for a stable estimate. If your traffic is high but volatile, shorter windows may be fine as long as they include full weekly cycles.
Compute the revenue delta using aggregate ratios
With no user IDs, you’re not “following users.” You’re comparing rates. A straightforward primary metric:
- RPS (Revenue per Pricing Session) = Total attributed revenue / Pricing sessions
Compute RPS for the before window and the after window, then estimate incremental revenue:
- Incremental revenue ≈ (RPS_after − RPS_before) × Pricing sessions_after
This answers a practical question: given the volume of pricing consideration you had after the change, how much more (or less) revenue did you generate per qualifying session?
Add a secondary funnel view
To understand why RPS moved, track supporting metrics:
- CTR to checkout = checkout_start / pricing sessions
- Checkout-to-purchase rate = purchase / checkout_start
- AOV = revenue / purchases
A pricing page edit might increase checkout clicks but reduce conversion later if it attracts less qualified buyers, or it might keep conversion stable but shift buyers to annual plans, lifting AOV. These diagnostics work well in aggregate because they’re event-count ratios.
Control for mix shifts without identity stitching
The biggest failure mode of before/after is attributing a change in traffic mix to your UI change. You can mitigate that without user IDs by segmenting the same aggregate calculations.
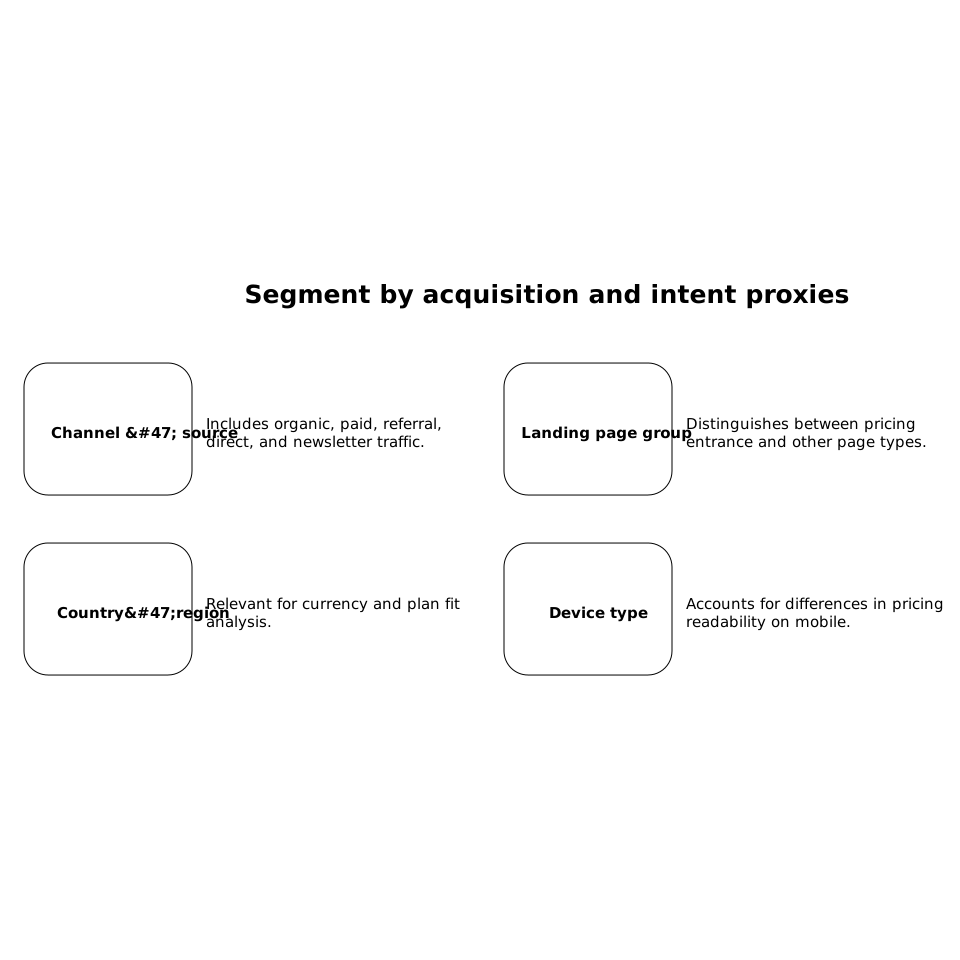
Segment by acquisition and intent proxies
- Channel / source (organic, paid, referral, direct, newsletter)
- Landing page group (pricing entrance vs not)
- Country/region (if relevant for currency and plan fit)
- Device type (pricing readability often differs on mobile)
Compute RPS_before and RPS_after within each segment. If overall RPS improved but paid traffic share also increased, a segmented view will reveal whether the uplift holds in organic, direct, and other stable segments.
Use a simple difference-in-differences check
If you have a “control surface” that shouldn’t be affected (for example, a documentation page that rarely leads to purchases, or a product page whose CTA and layout didn’t change), compute revenue per session on that surface too. If both pricing and control move in parallel, the driver is likely external (seasonality, campaign effects). If pricing moves but control stays flat, the evidence favors the pricing page change.
Practical implementation notes for cookieless analytics
With a cookieless setup, precision comes from event hygiene:
- Deduplicate purchases: ensure the purchase event fires once per successful transaction (server-side confirmation is ideal).
- Normalize currencies: convert to a reporting currency or segment by currency to avoid artificial AOV shifts.
- Keep event names stable: renaming events mid-window breaks comparability.
- Document deployments: log changes to the pricing page, checkout, and payment flow with timestamps.
Plausible Analytics supports goal and custom event tracking in a way that stays focused on aggregated outcomes rather than building identity profiles, which aligns naturally with this measurement approach.
How to interpret results responsibly
Before/after gives you a useful directional estimate, not absolute certainty. Treat the output as a decision tool:
- If RPS rises and the lift is consistent across stable segments, you likely improved monetization.
- If RPS rises only in one channel, investigate whether acquisition changed rather than pricing comprehension.
- If checkout CTR rises but purchase rate falls, revisit expectation-setting on the pricing page (copy, inclusions, billing terms).
If you need higher confidence later, you can layer on experiments (even simple split rollouts by time blocks) while keeping the same first-party event schema. The key is that you don’t need user IDs to be rigorous; you need consistent instrumentation and comparisons that respect what aggregate data can and cannot prove.