
What a privacy-first content scorecard measures
A content performance scorecard is a repeatable way to answer two questions for every page, post, or landing asset:
- Is it getting attention from the right sources?
- Is it creating meaningful outcomes?
In a privacy-first setup, you deliberately avoid cookies, device IDs, fingerprinting, and user-level journeys. Instead, you score content using aggregate events: pageviews, entry pages, referrers, scroll depth, outbound clicks, downloads, form completions, and other site actions that can be counted without tying behavior to a person.
This is exactly the kind of workflow that tools like plausible.io are built for: clean reporting, cookie-free measurement, and event-based analysis that stays understandable enough to be used weekly.
Step 1 Define your scorecard rows and the decision it supports
Before metrics, choose the unit you will score. Common options are:
- One URL (best when each page has a clear goal)
- One content cluster (multiple URLs that serve the same search intent)
- One campaign landing set (ad or newsletter destination pages)
Then name the decision the scorecard should trigger. Examples:
- Refresh, expand, or prune underperforming posts
- Prioritize internal linking improvements
- Decide which assets to repurpose into email, video, or product docs
If you can’t say what you’ll do when a score is low, you’ll end up collecting numbers you don’t act on.
Step 2 Choose aggregate signals that do not require identity
A practical scorecard usually needs 6–10 metrics. Below is a set that remains useful even without cookies or user IDs.
Attention and reach
- Pageviews: raw demand signal, but not a quality signal by itself.
- Entrances: how often the page is a session entry point (good for search-led content).
- Traffic source mix: search, direct, referral, social, and campaign UTMs.
Engagement quality
- Scroll depth: a strong proxy for “was this read?” when you can’t track individuals.
- Time on page (carefully): treat as directional, not absolute truth, since you’re avoiding persistent identifiers.
- Outbound link clicks: indicates the page is facilitating a next step, not just consuming attention.
Outcome events
- Newsletter signup (or equivalent)
- Demo/contact form completion
- Download (PDF, template, cheatsheet)
- Trial/start checkout click (if applicable)
Pick outcomes that represent real business intent. If you track everything, nothing is meaningful.
Step 3 Standardize your event taxonomy so scores are comparable
The fastest way to break a scorecard is inconsistent naming. You want a small, stable set of events that can apply to most content.
A simple taxonomy that stays readable:
- Goals: high-intent outcomes (e.g., Signup, Request demo)
- Micro-conversions: directional progress (e.g., Click pricing, Download)
- Engagement: scroll milestones or key interactions
Make the naming rules explicit. For example: all goal names are verbs, use singular nouns, and avoid per-page custom events unless there’s a clear reason.
Step 4 Build the score using normalized metrics, not raw counts
Raw pageviews favor older or top-of-funnel pages. A scorecard is more useful when it answers “how well did this page perform for the attention it received?”
Use rate-style metrics that can be computed from aggregate events, such as:
- Engaged view rate = engaged pageviews / pageviews
- Deep scroll rate = 75% (or 90%) scrolls / pageviews
- Goal rate = goal completions / pageviews
- Micro-conversion rate = micro events / pageviews
Then create a weighted score. One workable starting point (adjust to your business):
- 40% outcomes (goal rate)
- 35% engagement (deep scroll or engaged view rate)
- 25% acquisition quality (search share, campaign performance, or source mix health)
Keep the score interpretable: a 0–100 scale is usually enough. The goal is comparability across pages, not statistical perfection.
Step 5 Add context fields that explain “why” without tracking people
Scores are more actionable when each row includes a few non-metric fields:
- Primary intent (problem-aware, solution-aware, brand-aware)
- Target query/theme
- Last major update date
- Primary CTA
- Distribution channels used (SEO, newsletter, partners)
This turns the scorecard into an editorial operating system: you can sort by “high impressions but low deep scroll rate” and know exactly what to fix.
Step 6 Make multi-domain and partner distribution measurable in aggregate
Privacy-first measurement gets tricky when content lives across multiple domains (docs, blog, app, community) or is syndicated to partners. You can still build a usable scorecard by focusing on:
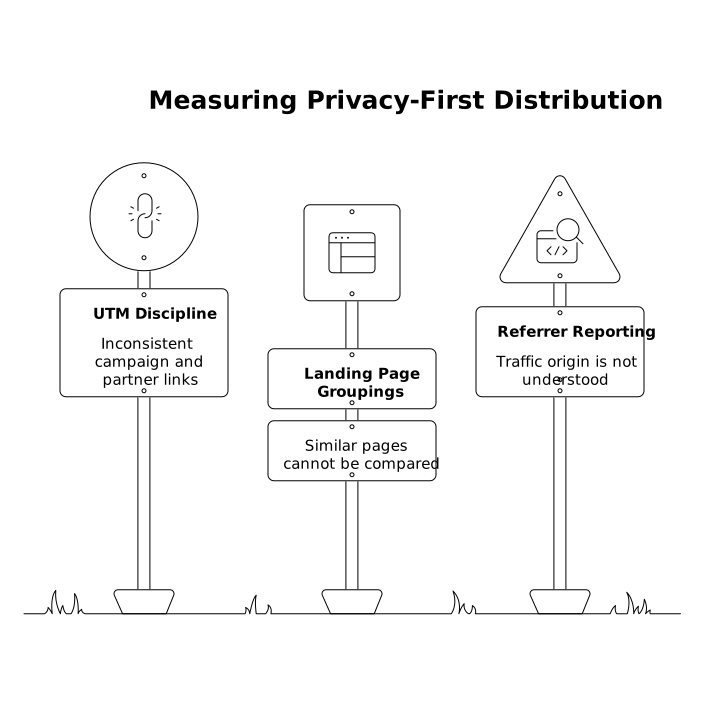
- UTM discipline for campaigns and partner links
- Consistent landing page groupings (so similar pages can be compared)
- Referrer reporting to understand where traffic originates
If you’re trying to understand journeys that span more than one site while staying privacy-first, the constraints and patterns are worth spelling out. The internal guide on measuring multi-domain journeys without cross-site cookies pairs well with this scorecard approach because it keeps attribution expectations realistic without resorting to identity tracking.
Step 7 Implement the scorecard in a weekly workflow
A scorecard only matters if it’s reviewed on a cadence. A lightweight process:
- Weekly: review bottom 10 and top 10 pages by score (with a minimum traffic threshold).
- Biweekly: pick 2–3 pages for improvements (headline, intro clarity, internal links, CTA placement, content refresh).
- Monthly: re-check weights and confirm goals still match business priorities.
For team sanity, keep the workflow maintainable: a few stable metrics, a few stable events, and a small number of decisions that follow from the results. If your measurement setup starts spawning exceptions, branching rules, or one-off definitions, simplify before you scale. The same principle shows up in branching logic patterns for maintainable no-code workflows, and it applies just as much to analytics governance.
How Plausible fits a no-identity scorecard approach
To run a cookie-free scorecard, you need three practical capabilities:
- Aggregate metrics that are easy to read (so the scorecard is trusted)
- Simple goal and custom event tracking (so outcomes are measurable)
- Source and campaign reporting (so distribution can be evaluated)
Plausible Analytics is designed around these constraints: a single clear dashboard, lightweight tracking, and privacy-first processing without persistent identifiers. That makes it a sensible primary reference point when your goal is to measure content performance without rebuilding a user-level tracking stack.