
Why YoY marketing reports quietly break after two months
Year-over-year reporting depends on one fragile assumption: the definition of a metric stays stable. In real marketing stacks, it often doesn’t. Ad platforms rename fields, adjust attribution defaults, retire legacy metrics, or change what a “conversion” means without a headline announcement. The result is a familiar pattern: your dashboards look fine for weeks, then a stakeholder asks why March this year is “down” versus last year—and the truth is that the underlying field stopped matching the same concept.
This is the two-month metric mapping time bomb: a silent deprecation or redefinition lands today, your pipelines keep running, and the damage only becomes obvious once you compare periods far enough apart—typically 6–10 weeks later when YoY views or quarterly reviews happen.
What a “silent deprecation” looks like in practice
A silent deprecation isn’t always a field disappearing. More often it’s a subtle shift that doesn’t throw an error:
- Same field name, different meaning (e.g., “conversions” now includes modeled events or excludes view-through).
- Field continues to populate but becomes partial (e.g., only for certain campaign types, placements, or objectives).
- A new canonical field replaces the old one, but the old field still exists for a while and is gradually deprioritized.
- Default attribution window changes in the UI while the API output stays the same—or vice versa—creating mismatched “truths.”
- Enum/value changes (a new campaign objective value appears and your mapping collapses it into “other”).
None of these necessarily break an extraction job. They break comparability.
Why it shows up two months later
The lag is caused by how teams validate reporting:
- Daily QA checks for freshness, not meaning. Most monitoring alerts when rows stop arriving, not when definitions drift.
- YoY is a periodic ritual. Many teams only deeply compare to last year during monthly business reviews, quarterly planning, or budget reallocations.
- Backfills mask the change. Some sources reprocess recent history when definitions change, so the “break” spreads slowly through the last few weeks of data.
By the time someone notices, you have already made decisions with mixed definitions: one part of the year is “old metric logic,” another part is “new metric logic.”
The common failure mode: mapping by label instead of contract
Most pipelines map metrics by human-friendly names: “Purchases,” “Leads,” “Revenue,” “CTR.” That’s convenient, but it’s not a contract. The contract is the combination of source + endpoint + field + attribution rules + filters + transformation logic.
When you harmonize fields across platforms, you also create a second risk: a platform changes its definition, and your normalized metric continues to be called “Purchases,” giving a false sense of continuity.
This is where a marketing data infrastructure layer helps—not by making changes impossible, but by making them observable and governable. Funnel.io, for example, is built to collect, normalize, and deliver performance data across ad, analytics, and CRM sources into analysis-ready datasets, which makes it easier to standardize naming and transformations—and just as importantly, to manage those transformations as a system rather than a spreadsheet habit.
Early-warning signals you can monitor (before stakeholders notice)
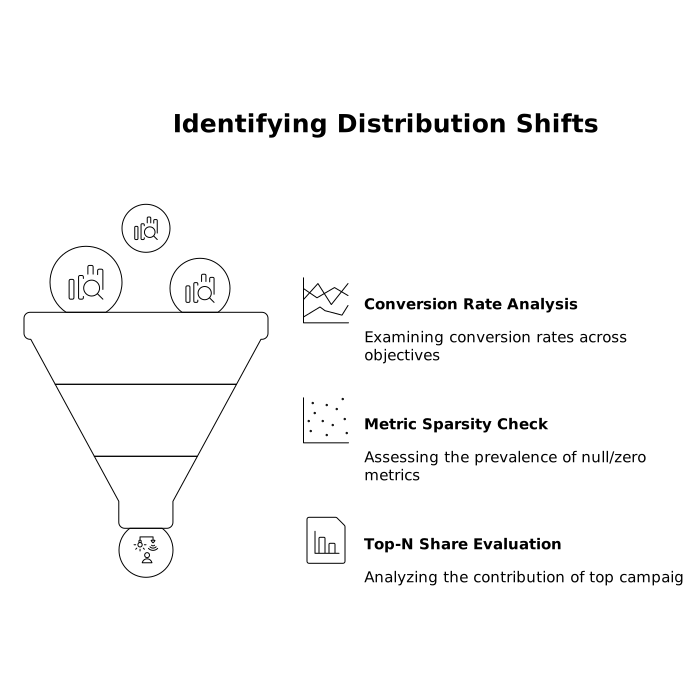
1) Distribution shifts, not just totals
Totals can look “reasonable” while the underlying mix changes. Add checks like:
- Conversion rate by campaign objective (a new objective can silently reframe what counts as a conversion).
- Metric sparsity: % of rows where a metric is null/zero by source and campaign type.
- Top-N share: if the top 10 campaigns suddenly account for far more (or less) of a metric, you may have a scope change.
2) “Schema present” doesn’t mean “metric valid”
Schema checks catch missing columns. They don’t catch redefinitions. Add semantic checks:
- Allowed range checks (e.g., CTR should rarely jump from 1–3% to 12–18% overnight for the same channel).
- Relationship checks (e.g., clicks should not fall below link clicks if both are present and historically ordered).
- Cross-field invariants (spend > 0 usually implies impressions > 0; if that breaks, investigate).
3) Platform-to-platform “echo tests”
When the same business outcome exists in multiple systems (ads platform, analytics, CRM), it won’t match perfectly—but it should move consistently. Track:
- Correlation over rolling windows between paid conversions and downstream CRM leads.
- Lagged ratios (e.g., leads-to-opportunities within 7–21 days). A definition change upstream often shows up as a ratio drift.
If you’re already fighting duplicate or ambiguous conversions, it’s worth aligning your monitoring with the risks described in Shadow Conversions and Duplicate Leads Across Ads Analytics and CRM.
Build a “metric mapping diff” process as a habit
Teams usually version code, but not metric meaning. A lightweight process can prevent most YoY surprises:
- Maintain a metric dictionary with: source field, definition notes, attribution window, filters, and transformation steps.
- Version the dictionary (git works; a controlled doc can work if it has change history).
- Require a mapping diff review whenever you add a new data source, change a transformation, or change a KPI calculation.
In practice, the biggest wins come from making “what changed?” answerable in minutes, not days.
How to detect a silent deprecation within days
Create a weekly “metric contract test”
Pick a small set of critical metrics (spend, impressions, clicks, primary conversion, revenue) and run weekly checks that compare:
- This week vs last week on distribution and sparsity (not just totals).
- This week vs same week last year on relationships (e.g., CVR bands, not raw counts).
- UI vs API sanity for a single campaign sample (one per major channel). The goal is not perfect match—just detection of definition drift.
Backfill-aware anomaly alerts
Some sources revise recent data for days. Your alerts should account for this by:
- Separating freshness anomalies from restatement anomalies (yesterday changes by +20% today).
- Alerting on unexpected restatement patterns (e.g., only one metric is being restated while others are stable).
Mitigation when you discover the break
When you confirm that a metric’s definition changed, the fix isn’t only technical—it’s analytical:
- Bracket your history: mark “pre-change” and “post-change” periods explicitly in your dataset.
- Decide on a canonical definition: either migrate fully to the new definition and backfill if possible, or keep the old definition and accept that the new source metric can’t be compared cleanly.
- Document the decision in the metric dictionary and in the dashboard notes.
- Rebuild YoY logic using comparable windows, or create a “normalized YoY” view that excludes the affected metric until it’s reconciled.
If the issue spans multiple domains or properties (common in modern measurement), tighten identity and journey assumptions as described in Measuring Multi-Domain Journeys Without Cross-Site Cookies—otherwise you may attribute a definition change to “tracking loss” and chase the wrong problem.
What reliable teams do differently
Teams with stable YoY reporting treat metric mappings like production systems:
- They monitor semantic quality, not just pipeline uptime.
- They keep a versioned metric contract and review diffs.
- They standardize transformations so changes are explicit and auditable.
- They use a central layer to normalize data across tools, so “what is a conversion?” is defined once and propagated consistently.
That’s how you defuse the two-month time bomb: detect meaning drift early, record it clearly, and keep your comparisons honest.
Vertical Video