
What you get in 30 minutes and why it matters
Hallucination reports are easy to collect and hard to operationalize. They often live as scattered screenshots, angry ticket threads, or vague “the model said something wrong” notes. A useful workflow turns those reports into two things you can actually act on:
- A source-of-truth coverage map that shows which claims are supported by which sources (and where your sources are missing, stale, or contradictory).
- A verification checklist that a human reviewer or automated QA step can run before a response ships.
The goal isn’t to eliminate hallucinations with a single trick. It’s to make failures legible, repeatable, and measurable so you can fix the system, not just the one answer.
The 30-minute workflow overview
This workflow is designed for teams handling real-world AI outputs: support copilots, RAG search assistants, internal knowledge bots, or content generation with citations. You can run it with a spreadsheet and a doc, but it works best when you turn the output into a visual artifact that’s easy to align on in reviews. A text-to-visual tool like napkin.ai is useful here because the deliverable is essentially a diagram: claims flowing to sources, with gaps highlighted.
Timebox it. You are not building a perfect ontology in 30 minutes. You are creating a reliable “first pass” map and checklist that you can iterate each week.
Minute 0–5: Normalize the hallucination report into a structured record
Start by converting a messy report into a single row (or card) with consistent fields. If the report came from a user, a QA tester, or logs, you want the same structure every time.
Minimum fields to capture
- Prompt context (the user ask, plus any system/tool context that matters)
- Model output (the exact text that is wrong)
- Wrong claim(s) extracted as short, testable statements
- Expected truth (what should have been said)
- Domain (billing, HR policy, medical info, product docs, etc.)
- Impact (low/medium/high) and failure mode (fabricated fact, wrong citation, outdated info, misread tool result)
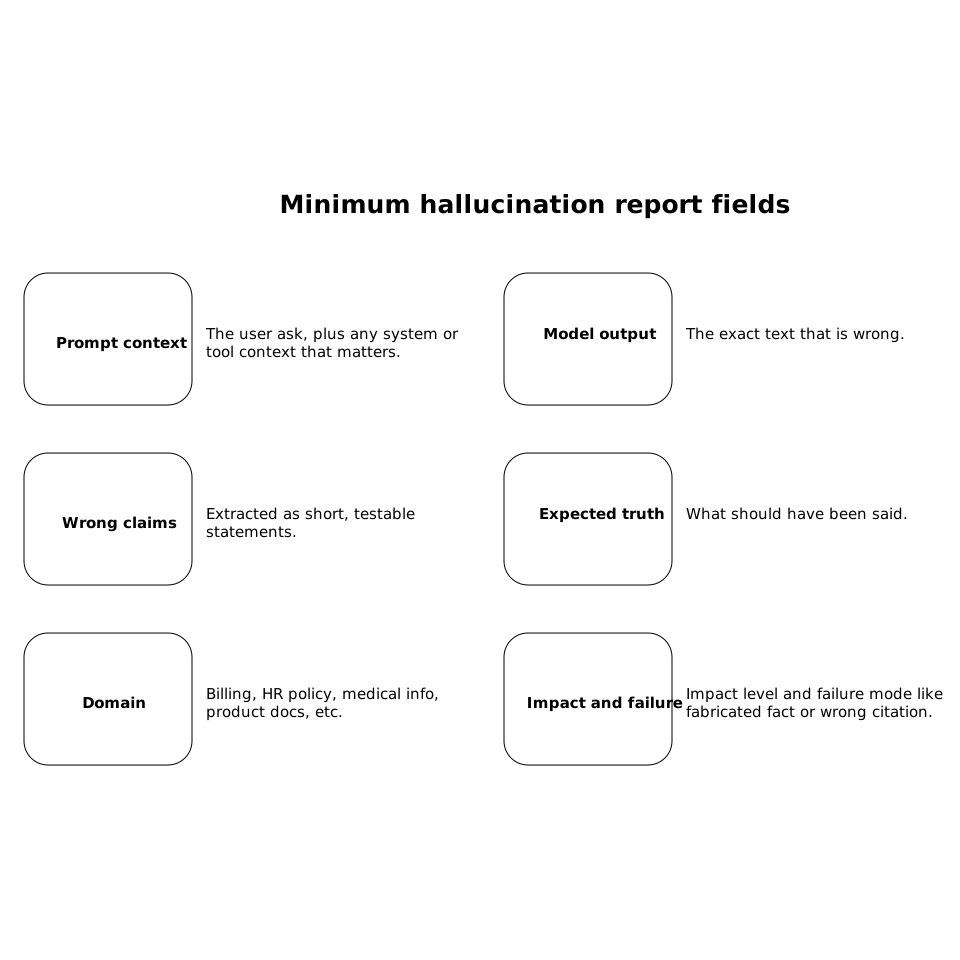
The key is extracting claims. Most “hallucination reports” are narratives; your coverage map will be claim-based.
Minute 5–12: Break the output into atomic claims and label what type each claim is
Take the model output and split it into atomic claims—statements that can be verified independently. One paragraph might contain 5–10 claims. Keep them short, unambiguous, and testable.
Claim types that make mapping faster
- Entity claims: a person/product/policy exists, name is correct
- Attribute claims: pricing, dates, eligibility rules, limits
- Procedural claims: steps to do a task, required forms
- Comparative claims: “X is faster than Y,” “Plan A includes more than Plan B”
- Citation claims: “According to Source S, …”
This step is where teams usually go wrong: they try to validate the whole answer at once. Mapping works only when you can point to a specific claim and ask, “Which source proves this?”
Minute 12–20: Build the source-of-truth coverage map
The coverage map is a simple relationship model:
- Claims (your atomic statements)
- Sources (docs, database tables, APIs, policies, changelogs)
- Coverage edges (source supports claim, partially supports it, or contradicts it)
In practice, represent it as either (1) a table where each claim links to one or more sources, or (2) a diagram that makes gaps obvious. Diagrams help when multiple teams own different sources.
What “coverage” means (be explicit)
- Supported: the source directly states the claim in the same meaning and scope
- Weakly supported: source implies it, but leaves room for misinterpretation
- Not covered: no source in your system can justify the claim
- Conflicting: two sources disagree or a source is outdated
If your system uses RAG, add two extra fields:
- Was the correct source retrievable? (indexing, chunking, permissions)
- Was it used correctly? (did the model cite it and preserve meaning?)
If wrong citations are a recurring issue, pair this with a test loop approach like synthetic Q&A checks. The workflow in synthetic Q&A loop testing is particularly relevant when your assistant produces citations that look plausible but don’t support the statement.
Minute 20–27: Turn the map into a verification checklist you can run every time
Now convert your coverage map into a checklist that matches your review flow. The checklist should be usable by:
- a human reviewer doing spot checks,
- a QA analyst validating high-impact answers, or
- an automated gate that blocks responses missing required evidence.
A practical checklist template
- Claim inventory: Have we extracted the key claims (especially numbers, dates, eligibility, and “according to” statements)?
- Source linkage: Does each high-impact claim map to at least one approved source?
- Scope match: Does the source apply to the user’s locale, plan tier, timeframe, or account type?
- Freshness: Is the source current enough for this domain (pricing and policy change more often than definitions)?
- Conflict resolution: If sources conflict, is there a defined precedence rule (e.g., product database > help center article)?
- Quote or snippet check: For critical claims, confirm the supporting text exists verbatim or near-verbatim in the source.
- Citation integrity: If you show citations, do they actually support the specific claim they’re attached to?
Keep it short. A checklist that takes 15 minutes won’t be used. Your coverage map supplies the detail; the checklist is the “go/no-go” gate.
Minute 27–30: Document actions and feed them back into your system
The final three minutes are about converting insights into fixes. For each “not covered” or “conflicting” claim, choose one action:
- Add or approve a source (policy doc, canonical page, database field)
- Improve retrieval (chunking, metadata, access controls, synonyms)
- Constrain generation (require citations for certain claim types; block unsupported numeric assertions)
- Add a guardrail test (a regression prompt that fails if the claim reappears)
If your hallucinations often originate from tool misuse (wrong parameter, misread JSON, or ambiguous schema), you’ll get more leverage by standardizing tool interfaces and normalizing inputs. The techniques in canonical schemas and input normalization are useful not just for security, but also for preventing “confidently wrong” tool-driven outputs.
How to keep the workflow lightweight week after week
This process works when it becomes routine. Two small practices keep it from ballooning:
- Define “high-impact claim” upfront (money, compliance, safety, access, irreversible actions). Only those require strict evidence each time.
- Version your coverage map by date and source revision, so you can see if hallucinations correlate with source changes or stale indexes.
Over time, your coverage map becomes a living index of what your assistant is allowed to assert—and what must be phrased as uncertainty or a request for clarification.